


School accountants, bookkeepers, and other administrative professionals are forever thinking about their school's assets, liability, equity, revenues, and expenses. Having a one-stop-shop where you can find all your accounts, along with their designated intent codes, can make your life exponentially easier. That's where a chart of accounts for schools comes in.
A chart of accounts (COA) allows your school's accounting and/or bookkeeping team to categorize each transaction. Below, we unpack everything you need to know about using a chart of accounts for your school.
What Is a Chart of Accounts?
A chart of accounts is literally an inventory of all the accounts that are found in the general ledger your school uses to code every individual transaction.
Simply put, a chart of accounts is an organizational tool. A good chart of accounts for school business can make it easier for your team to locate specific accounts, transactions, and more.
Your school's chart of accounts does not need to look like anyone else's—each school can customize its chart of accounts to best suit its bookkeeping needs. In fact, it's important to do just that; every single school has unique accounts and transactions.
What Is an "Account"?
An account, in this context, is a record for every kind of asset, liability, equity, revenue, and expense attributed to your school. A chart of accounts sorts and points to the unique identifiers for each account, making tracking transactions a breeze.
A Brief Overview of School Revenue and Expenditures
According to the National Center for Education Statistics at IES report, Revenues and Expenditures for Public Elementary and Secondary Education: FY 17 (PDF), the 50 states (and the District of Columbia) reported $705.3 billion in revenues collected for public elementary and secondary education in the fiscal year 2017.
State and local governments provided $648.0 billion, or 91.9% of all revenues. The federal government contributed $57.3 billion, or 8.1% of all revenues. Total revenues increased by 2.3% (from $689.7 to $705.3 billion) from FY 16 to FY 17, local revenues increased by 2.4% (from $309.2 to $316.6 billion), state revenues increased by 2.4% (from $323.5 to $331.3 billion), and federal revenues increased 0.5% (from $57.0 to $57.3 billion).
Current expenditures for public elementary and secondary education in the United States increased by 2.0% between FY 16 and FY 17 (from $607.2 to $619.2 billion). Within that increase, expenditures for instruction also increased by 1.7% between FY 16 and FY 17 (from $369.8 to $376.1 billion); and student support expenditures increased by 3.8% in FY 17 compared to FY 16 (from $34.6 to $35.9 billion).
As for private schools, which do not receive tax revenues, things look a little different. Private school funding comes from tuition, donations, and private grants. According to theNational Association of Independent Schools, the average tuition for private day schools in 2020 in the United States is $26,866, the average tuition for 5-day boarding schools is $46,475, and the average 7-day boarding school tuition is $60,600.
This clocks the median income per student at $28,317, while the median total expenses per student $27,738. Overall, ~$67 billion was spent by private elementary and secondary schools in the 2018-19 school year, and the market size (measured by revenue) of the private school industry is $86.4 billion in 2020.
When it comes to organizing and reporting your school's financial data, it might seem wise to replicate a chart of accounts you find online rather than starting from scratch. However, each school is financially unique—and remember, no two states (or even districts!) have the same funding systems.
These differences depend upon decisions made by state legislatures, school boards, and the federal government. And educational expenditure is even more varied, especially when it comes to comparing public and private schools; so, a chart of accounts for private schools or independent school chart of accounts will look quite different.
Why Is Having a Chart of Accounts Important?
A chart of accounts is an incredibly valuable reporting tool that provides organization and clarity to your school's financial information. A COA is designed to provide a clear understanding and provide insight into your institution's financial health. Having a chart of accounts also ensures adherence to financial reporting standards.
It used to be that public and private schools both reported financial information using the same form, now known as the“Common Form” (or “Old Form”). Then in 1997, private institutions began reporting under the Financial Accounting Standards Board (FASB).
Public schools were also affected by changes to the Governmental Accounting Standards Board (GASB), which the Integrated Postsecondary Education Data System (IPEDS) phased in between 2002 and 2004. All public institutions were required to report using GASB standards by 2004.
The “Aligned Form” was phased in for both FASB- and GASB-reporting institutions starting in 2008; it became mandatory for all institutions in 2010. These “Aligned Forms” include the GASB for public institutions (F1), FASB for public and private, not-for-profit institutions (F2), and FASB for private, for-profit institutions (F3). Beginning with the 2014-15 collection cycle, the FASB for for-profit institutions (F3) was revised even further to increase comparability with the other two forms (F1 and F2).
The major areas affected by the changes in accounting standards over time are revenues, expenses/expenditures, and scholarships and fellowships. Aside from accurate and informative reporting, the financial insights gathered from holistic financial reporting are paramount to understanding the financial health of your school. That’s where the chart of accounts comes in.
How Do I Create a Chart of Accounts?
The exact layout of the chart of accounts depends on the exact reporting requirements of your school and adherence to the GASB put forth by the Financial Accounting Standards Board (FASB). Regardless of how your team chooses to lay your COA out, be sure to keep it as simple and straightforward as possible. Your school can create their COA in either a spreadsheet or Word Document; whatever you're more comfortable working in is the best option.
What to Include in Your School's Chart of Accounts
First of all, you'll most likely want to divvy up your school's chart of accounts into sections that make for quick navigation in the sheet or document. A standard chart of accounts list of categories may include the following:
- Administration
- Instruction
- Teaching materials
- Operations and maintenance
- Community services
- Acquisition, improvement, and replacement of fixed assets
- Professional development
Once you have the categories established, you can add any pertinent information, such as:
Account name: The name of the account in the general ledger. The account names will depend on your type of business, but the classification and grouping should be similar to the sample chart of accounts.
Account description: Typically, you'll want to include a brief description of what each account or program's function or purpose is.
Program intent code: Each account should have a unique code or reference number to identify it. Account numbers are typically~five digits, with each number representing the department, the type of account, etc. When allocating account codes (chart of accounts numbers), don’t forget to leave space for additional accounts and codes to be added later!
Group: The group refers to the categorization of the account. Groups include:
- Current assets
- Long term assets
- Current liabilities
- Long term liabilities
- Equity
- Income
- Cost of sales
- Expenses
Sub-group: sub-groups help to categorize each account into classifications that your team needs to present the balance sheet and income statement in accounting reports.
Current assets:
- Cash and cash equivalents
- Short term marketable securities
- Accounts receivable
- Inventory
- Other current assets
Long-term assets:
- Property and equipment
- Philanthropy
- Intellectual property
Current liabilities:
- Notes payable
- Accounts payable
Long-term liabilities:
- Mortgages
- Bonds
Equity:
- Capital
- Retained earnings
Income:
- Revenue
- Donations
Expenses:
- Research and development
- Sales and marketing
- General and administrative
- Depreciation
- Taxes
Object code expenditures: You may also want to include object codes, when applicable, to define the category of expenditures. As an example, your school's COA object codes might be:
- 01 Salaries, Professional
- 02 Salaries, Clerical
- 03 Salaries, Other
- 04 Contract Services
- 05 Materials and/or Supplies
School Chart of Accounts Sample
There are tons of COA samples and templates on the web, so it's easy to find inspiration (or even lay a foundation) for your public or private school chart of accounts. Your team may opt to keep it super simple, as this Bench sample does, or add more detail and identifying information. It's up to your school's accounting team to decide. A more detailed (yet still straightforward) chart of accounts might look something like this:
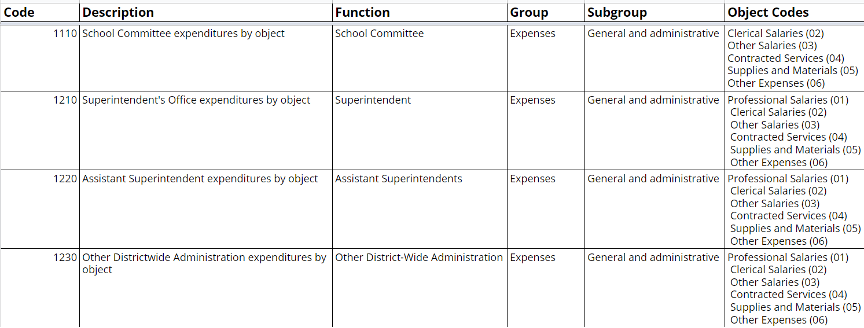
This template can be used as a sample chart of accounts for private schools or public schools. You can download it here →
How Do I Use a Chart of Accounts?
Each and every business transaction should be recorded in your COA. But how do you know which account to record it in? In general, there are different financial statements that each account corresponds to the balance sheet and the income statement.
Your balance sheet provides a comprehensive overview of your school's finances. Balance sheet accounts include:
- Asset accounts: any resource of value your school owns, e.g., property, equipment, and accounts receivable.
- Liability accounts: all the debt your school owes, e.g., accounts payable, taxes payable, and wages payable.
- Equity accounts: Equity = Assets -Liabilities. Sometimes referred to as the book value of the company.
- Your income statement (or profit and loss statement) focuses on the company’s revenue and expenses during each accounting period. There are two types of accounts included in income statements:
- Revenue Accounts: a reflection of the revenue your school brings in.
- Expense Accounts: a reflection of all of the funds, resources, etc. that your school uses to generate revenue.
Once your team understands which account is which, you can start taking full advantage of your chart of accounts; it will allow your team to stay on top of your school's finances, know what you owe, track assets, fill out tax forms, and more.
Getting Started
Consistent, comprehensive financial reporting is a must for every school. Creating a well-organized chart of accounts can help to simplify operations and management and gain insight into the financial health of your school. Using the above information and samples as a guide, establishing your school's chart of accounts will be a breeze. Once you get set up, your team will use your COA—and build on it—for many years to come.